
Customer journey maps explained for business teams

A customer journey map is a visual timeline of every step a customer takes with your organisation, showing their actions, thoughts, emotions, and pain points at each stage. As the Nielsen Norman Group describes it, journey mapping combines storytelling and visualisation to create a shared timeline that teams can genuinely act on. Get it right and you move from inside-out process thinking to outside-in customer-centricity, which tends to produce measurable gains in retention, acquisition, and cross-functional alignment.
Harvard Business School frames the map as a living document that should be audited and refreshed as customer behaviour changes, not filed away after a workshop. IMD reinforces that point: maps grounded in real research lead to increased acquisition, stronger retention, and better ROI. That combination of rigour and regular upkeep is what separates a map that drives change from one that decorates a wall.
Key takeaways
A customer journey map is only as useful as the research behind it and the ownership structure that follows it.
| Point | Details |
|---|---|
| Define before you map | Set a clear objective and choose one persona before the workshop; scope determines everything else. |
| Research comes first | Combine customer interviews with quantitative data; maps built on anecdote alone produce unreliable insights. |
| Assign owners in the room | Every pain point and opportunity needs a named owner agreed during the workshop, not delegated afterwards. |
| Treat it as a living document | Schedule a quarterly review cadence so the map stays aligned with changing customer behaviour. |
| Michaelbell turns maps into programmes | Michaelbell’s mapping engagements deliver a visual map, insights register, ownership matrix, and quick-win roadmap connected to measurable communications outcomes. |
Table of Contents
- What does a customer journey map include?
- Which type of journey map should you use?
- How to create a customer journey map, step by step
- Which research sources make a journey map trustworthy?
- How to visualise your journey map effectively
- What are the business benefits of journey mapping?
- Typical timelines, team roles, and cost considerations
- How do you measure success after journey mapping?
- Common mistakes that undermine journey mapping
- How Michaelbell runs journey mapping engagements
- Why we prioritise journey maps at Michaelbell
- Michaelbell’s customer journey mapping service
- Sources
What does a customer journey map include?
Every credible journey map shares a core set of components. Miss one and the map loses its ability to guide decisions. Here is what each element does and why it earns its place.
- Personas. A named, research-backed profile of the customer segment the map covers. Without a specific persona, the map tries to represent everyone and ends up representing no one. Well-constructed buyer personas are the foundation every other component rests on.
- Journey stages. The high-level phases a customer moves through, typically awareness, consideration, purchase, retention, and advocacy. Stages give the map its horizontal spine.
- Touchpoints. Every moment the customer interacts with your brand, whether that is a Google ad, a customer service call, or a delivery notification. Missing touchpoints leave blind spots in the experience.
- Customer actions. The specific things a customer does at each touchpoint: searches a term, opens an email, calls support. Actions make the map concrete rather than abstract.
- Thoughts and emotions. What the customer is thinking and feeling at each stage. This layer is where maps reveal the gap between what organisations assume customers feel and what they actually feel.
- Pain points. Friction, confusion, or frustration that slows the customer down or pushes them towards a competitor. Pain points are often the highest-value targets for improvement.
- Channels. The medium through which each interaction happens: search, social, email, in-store, phone. Mapping channels alongside touchpoints exposes inconsistency across platforms.
- Moments of truth. The two or three interactions that disproportionately shape the customer’s overall perception. Identifying these helps teams prioritise effort.
- Metrics and KPIs. Quantitative signals tied to each stage, such as conversion rate, Net Promoter Score (NPS), or support resolution time. A map without metrics cannot be measured or improved.
- Insights and ownership. The so-what for each pain point or opportunity, plus a named owner responsible for acting on it. This is the component most teams forget, and its absence is why so many maps gather dust.
Pro Tip: Match the granularity of your map to its purpose. A strategic map for a board presentation needs five to seven stages and headline emotions. An operational map for a product team needs every micro-step and a metric against each touchpoint. Building one map to serve both audiences usually serves neither.
Which type of journey map should you use?
Choosing the wrong map type wastes time and produces a deliverable nobody uses. The four most common types each serve a distinct purpose.
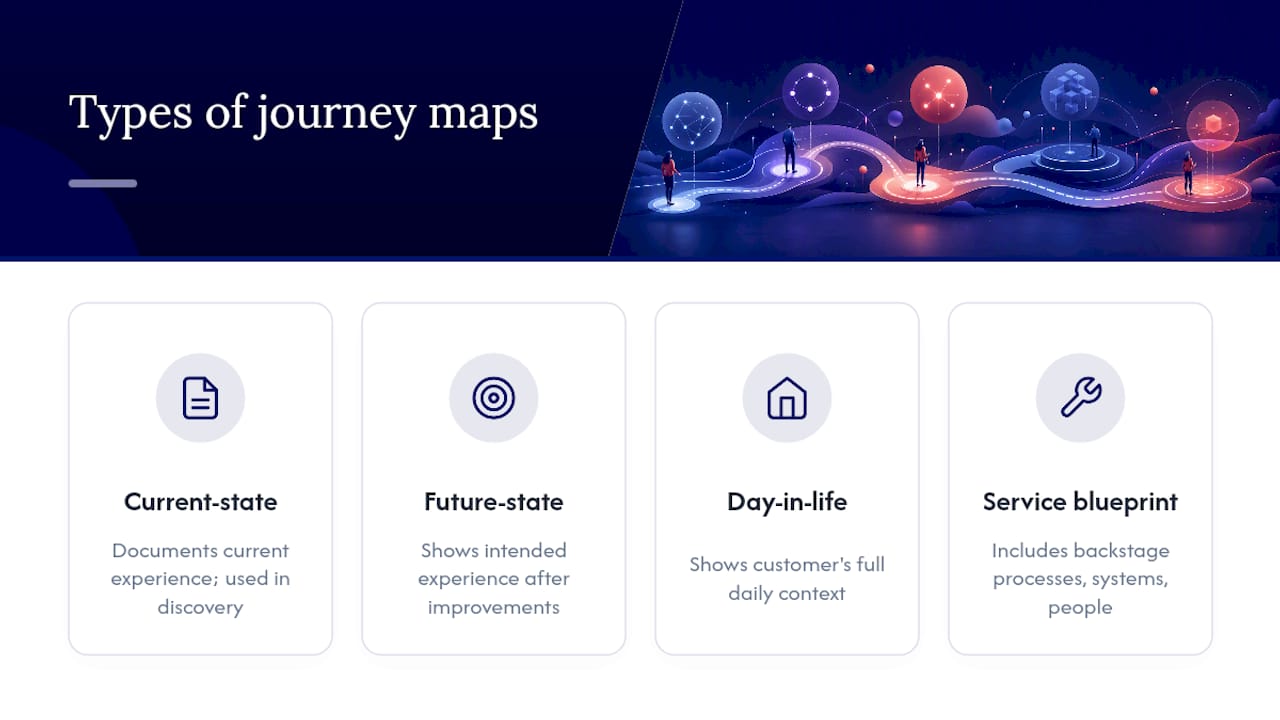
Current-state map (as-is). Documents the experience as it exists today, warts and all. This is the right starting point for any organisation that has not mapped before, or one that suspects a gap between assumed and actual experience. It is the most common type used in discovery workshops.
Future-state map (to-be). Describes the intended experience after improvements are made. Useful for product launches, service redesigns, and communicating a target vision to stakeholders. It works best when built directly from the insights a current-state map surfaces, not from aspiration alone.
Day-in-the-life map. Zooms out beyond your brand to show the customer’s full daily context, including interactions with competitors, life events, and environmental factors. This type is particularly useful for identifying unmet needs that no competitor is addressing yet, which feeds directly into brand differentiation.
Service blueprint. Extends the customer-facing journey to include the backstage processes, systems, and people that enable each touchpoint. The blueprint is the right tool when the root cause of a customer pain point lies in an internal process rather than a customer-facing one. The UK Government Communication Service recommends journey mapping for scoping public-facing services, and the service blueprint is the format most suited to that level of operational detail, as Gov confirms.
For omnichannel consistency, a channel-focused variant of the current-state map, which layers channel data across each stage, is often the quickest route to identifying where the experience breaks down between online and offline.
How to create a customer journey map, step by step
A map built in a single afternoon without research is an opinion document, not a customer journey map. The process below is the one we use at Michaelbell for engagements ranging from a two-week discovery sprint to a multi-month programme.
- Define your objective and scope. Decide what question the map must answer. Is it “why are customers churning after onboarding?” or “where does the checkout journey lose conversions?” A clear objective determines which persona, which stages, and which data sources you need.
- Select your persona or segment. Choose one persona per map. Trying to map multiple segments on a single canvas produces a blurred average that does not reflect anyone’s real experience.
- Gather quantitative and qualitative data. Pull analytics, CRM records, support tickets, and survey data before the workshop. Qualitative depth comes from customer interviews and session replays. The HBS guidance is clear: maps that rely on anecdote rather than triangulated data produce unreliable insights.
- Outline the stages. Agree the stage names with your team before the workshop. Stages should reflect the customer’s perspective, not your internal process names.
- List touchpoints and customer actions. For each stage, list every interaction point and the specific action the customer takes. Involve colleagues from sales, support, and operations here, as they hold knowledge the marketing team often lacks.
- Map emotions and pain points. Plot the customer’s emotional state at each touchpoint on a simple high-to-low scale. Where the line dips, there is a pain point. Where it rises sharply, there is a moment of truth worth protecting.
- Identify opportunities and quick wins. For each pain point, generate at least one potential fix. Separate quick wins (changes that can be made in days or weeks) from strategic opportunities (changes that require investment or structural change).
- Assign ownership and metrics. Every opportunity needs a named owner and a metric that will confirm improvement. This step is non-negotiable. As the Nielsen Norman Group notes, journey mapping workshops are often more valuable than the final graphic precisely because the cross-functional conversation creates shared definitions and accountability.
- Prototype the visual map. Build a draft using your chosen tool or template. Keep it legible at a glance for stakeholders and detailed enough for the operational team.
- Test and validate with customers. Share the draft with a small group of real customers or conduct a follow-up interview round to check whether the map reflects their actual experience.
- Plan updates and governance. Set a review cadence, typically quarterly for fast-moving categories and bi-annually for stable ones. Assign a map owner who is responsible for keeping it current.
Pro Tip: Assign ownership for pain points and opportunities during the workshop itself, not afterwards in a follow-up email. When owners are named in the room, in front of peers, the accountability is real. When it is delegated later, it tends to evaporate.
Half-day workshop agenda
| Time | Activity | Output |
|---|---|---|
| — | Objective setting and persona briefing | Agreed scope document |
| — | Data review and insight sharing | Prioritised insight list |
| — | Touchpoint and emotion mapping | Draft journey canvas |
| — | Opportunity identification and ownership | Owners list and quick-win backlog |
Two-day workshop agenda
Day one covers steps 1–6 above, with customer interview playback in the morning and collaborative mapping in the afternoon. Day two focuses on steps 7–11: opportunity prioritisation, ownership assignment, visual prototype, and governance planning.
Which research sources make a journey map trustworthy?
The quality of a journey map is only as good as the data behind it. Most teams under-invest in research and over-rely on internal assumptions.
Qualitative sources give you the why behind customer behaviour:
- Customer interviews (30–60 minutes, semi-structured, five to eight participants per persona)
- Field studies and contextual observation
- Diary studies, where customers log their experience in real time over several days
- Focus groups, useful for exploring emotional responses to concepts
- Call centre transcripts and live chat logs, which surface pain points at scale without additional recruitment
Quantitative sources give you the what and how many:
- Web and app analytics (Google Analytics 4, Adobe Analytics)
- Session replay tools (Hotjar, Microsoft Clarity)
- Customer satisfaction surveys (NPS, CSAT, CES)
- CRM data and purchase history
- Support ticket categorisation and resolution data
- Social listening platforms
The right approach combines both. Qualitative interviews reveal the nuance; quantitative data confirms whether that nuance is widespread or an outlier. Leveraging customer data effectively means triangulating across at least three source types before drawing conclusions.
A quick research plan for a standard mapping project:
- Week 1: Pull existing analytics, CRM, and support data. Identify the top five pain-point hypotheses.
- Week 2: Conduct five to eight customer interviews to test those hypotheses. Record and transcribe.
- Week 3: Run a short survey (200+ responses) to quantify which pain points are most common.
- Week 4: Synthesise findings and brief the workshop team.
Validation checklist to avoid confirmation bias:
- Have at least two team members independently code interview transcripts before comparing notes.
- Check that your interview sample reflects the demographic spread of your actual customer base, not just the easiest people to recruit.
- Cross-reference qualitative findings against quantitative signals before treating them as fact.
- In the UK context, follow ICO guidance on data collection consent and anonymisation when using customer recordings or CRM data in research.
How to visualise your journey map effectively
A journey map that nobody can read is a journey map nobody uses. Visual clarity is not a design nicety; it is a functional requirement.
Common layout formats:
- Timeline (horizontal swimlane). The most common format. Stages run left to right; rows show touchpoints, emotions, pain points, and metrics. Works well for linear journeys and stakeholder presentations.
- Matrix. Stages on one axis, channels or personas on the other. Useful for omnichannel journeys where the same stage plays out differently across web, app, and in-store.
- Storyboard. Uses illustrated panels to show the customer experience scene by scene. Effective for executive presentations where emotional resonance matters more than operational detail.
- Service blueprint overlay. Adds backstage processes and systems beneath the customer-facing timeline. The right format when you need to connect customer pain points to internal root causes.
Tool categories to consider:
- Collaborative whiteboard tools (Miro, MURAL, FigJam) are well-suited to live workshops and remote teams. They allow real-time editing and are easy to share.
- Diagramming tools (Lucidchart, Microsoft Visio) produce cleaner, more structured outputs suited to formal documentation.
- Presentation tools (PowerPoint, Google Slides, Keynote) work for executive-facing summary versions but lack the collaborative editing features needed during the mapping process itself.
- Dedicated CX platforms (Smaply, Custellence) offer purpose-built templates and persona management, which is useful for teams running mapping programmes at scale.
Zendesk’s guidance recommends collaborative, template-driven approaches that make it easier to build, share, and iterate maps across teams.
Template checklist: required fields for any visual map:
- Persona header (name, segment, key characteristics)
- Journey stages (five to seven, customer-perspective labels)
- Touchpoints per stage
- Customer actions per touchpoint
- Emotion curve (visual high-to-low scale)
- Pain points (flagged clearly, not buried in notes)
- Channels per touchpoint
- Metrics and KPIs per stage
- Ownership column (named individual or team)
- Insights and opportunities (prioritised)
Format by audience:
- Executive summary: one-page visual with headline emotions, top three pain points, and top three opportunities.
- Workshop deck: full swimlane with all components, used as the working document during the session.
- Operational playbook: detailed map with ownership matrix, metric baselines, and action backlog attached.
As HubSpot notes, maps reveal customer needs and motivations across stages and support conversion and retention improvements when grounded in research and paired with clear templates.
What are the business benefits of journey mapping?
Journey mapping is not a theoretical exercise. Organisations that run it well report concrete, measurable outcomes.
Retention and churn reduction. Mapping surfaces the moments where customers disengage before they actually leave. Fixing friction at those points, whether that is a confusing onboarding email or a slow support response, tends to improve retention. Proven customer retention strategies consistently point to understanding the customer’s emotional state at key touchpoints as a primary lever.

Conversion improvement. Maps identify where customers drop out of the purchase journey. In e-commerce, cart abandonment rates are a widely tracked benchmark for measuring checkout journey improvements, and reducing friction at the payment stage is one of the most direct applications of journey mapping.
Cross-functional alignment. When sales, marketing, product, and support teams map together, they build a shared vocabulary and shared ownership. That alignment tends to outlast the map itself.
Faster sales cycles. Understanding where prospects stall in the consideration stage allows marketing and sales teams to intervene with the right content or conversation at the right moment.
Better support outcomes. Mapping the post-purchase experience regularly reveals that customers contact support because of a gap in onboarding communications, not because the product is broken. Fixing the communication is cheaper and faster than scaling the support team.
Common use cases:
- Onboarding optimisation: reducing time-to-value for new customers
- Cart abandonment reduction: identifying and fixing checkout friction
- Service recovery: designing a consistent response to complaints that rebuilds trust
- Omnichannel consistency: ensuring the experience is coherent across web, app, email, and in-store
- Product roadmap prioritisation: using pain-point data to rank feature development
Typical timelines, team roles, and cost considerations
Mapping projects vary enormously in scope. Here is a realistic picture of what different engagements look like.
Typical project timelines:
- Quick discovery (1–2 weeks). One persona, one journey stage, existing data only. Suitable for a specific problem (e.g., checkout drop-off) where the team already has good data. Output: a single-page map and a quick-win backlog.
- Standard map (4–8 weeks). One to two personas, full end-to-end journey, primary research included. Suitable for most marketing and CX improvement projects. Output: full visual map, insights register, ownership matrix, and measurement plan.
- Enterprise programme (continuous cadence). Multiple personas, multiple journeys, integrated with CRM and analytics platforms. Suitable for organisations embedding journey mapping as an ongoing practice. Output: a living map library, quarterly review cadence, and a cross-functional governance structure.
Team roles:
- Project sponsor. Senior leader who owns the business objective and can unblock resource decisions.
- CX or research lead. Designs and runs the research programme and facilitates the workshop.
- Designer. Produces the visual map and maintains the template library.
- Product or operations representative. Brings knowledge of internal processes and systems.
- Analytics owner. Pulls and interprets quantitative data before and after the mapping exercise.
- Marketing lead. Connects map insights to communications planning and campaign briefs.
Budget shape:
In-house-led projects typically carry lower direct costs but higher hidden costs in staff time and the risk of confirmation bias. Agency-run engagements bring external research capability, facilitation experience, and an objective perspective, which tends to produce more credible outputs and faster stakeholder buy-in. The primary cost drivers are the depth of primary research, the number of personas and journeys in scope, and whether the engagement includes implementation support beyond the map itself.
How do you measure success after journey mapping?
A map without a measurement plan is a hypothesis, not a programme. Measurement starts before the workshop, not after.
Metrics mapped to objectives:
- Retention and churn: monthly retention rate, churn rate by cohort, customer lifetime value
- Conversion: conversion rate at key touchpoints, cart abandonment rate, lead-to-close rate
- Customer satisfaction: NPS, CSAT, Customer Effort Score (CES)
- Support efficiency: first-contact resolution rate, average handling time, escalation rate
- Engagement: email open and click rates, session duration, repeat visit frequency
Ownership checklist:
- Every insight in the map has a named owner.
- Every owner has a metric that defines what “improved” looks like.
- Actions are logged in a shared backlog (a simple spreadsheet works; a project management tool is better).
- The map owner schedules a quarterly review to check whether actions have been completed and whether the map still reflects current customer behaviour.
Measurement tips:
- Baseline every metric before the workshop so you have a pre-intervention benchmark.
- Use A/B or incremental testing to isolate the impact of specific fixes rather than attributing all improvement to the mapping exercise.
- Produce a one-page ROI summary for stakeholders that connects specific actions to specific metric movements.
Pro Tip: When presenting ROI to leadership, tie each improvement to a metric they already track. If the CFO watches monthly churn, show how fixing the onboarding email sequence moved that number. Connecting the map to existing KPIs is far more persuasive than introducing new metrics.
Data-driven testing after a mapping exercise is what separates teams that improve continuously from those that run a workshop and move on.
Common mistakes that undermine journey mapping
Most mapping failures are predictable. Here are the ones we see most often, and the fixes that work.
Treating the map as a one-off. A map built in January and not reviewed until the following year is almost certainly out of date. Customer behaviour shifts; the map must shift with it. Schedule a review cadence at the end of the workshop, not six months later.
Using anecdotes instead of data. One memorable customer complaint is not a pattern. Qualitative interviews must be combined with quantitative signals before a pain point is treated as a priority.
Missing ownership. A map that lists opportunities without naming owners produces a beautiful document and zero change. Assign owners in the room.
Overcomplicating the visual. A map with forty touchpoints and twelve rows of data is unreadable in a meeting. Build a summary version for stakeholders and a detailed version for the operational team.
Leaving out metrics. Without a baseline metric per stage, there is no way to know whether the map led to improvement.
A typical failure pattern: a retail team maps the post-purchase journey, identifies that the delivery notification emails are confusing, but assigns the fix to “the email team” without a named individual or a deadline. Six months later, the emails are unchanged. The fix is simple: name one person, set a four-week deadline, and agree that open rate and CSAT on delivery communications are the success metrics. That level of specificity is the difference between a map that changes things and one that does not.
Pro Tip: Start with one journey, one persona, and one clear objective. A focused map that produces three implemented improvements is worth more than a comprehensive map that produces none.
How Michaelbell runs journey mapping engagements
At Michaelbell, customer journey analysis sits at the centre of how we build brand communications programmes. We do not treat mapping as a standalone deliverable; we treat it as the diagnostic that informs everything from campaign briefs to internal communications strategy.
Our sprint plan for a standard engagement:
- Discovery (week 1–2). Stakeholder interviews, existing data audit, and hypothesis development. Deliverable: a scoped research brief signed off by the project sponsor.
- Research (week 3–4). Customer interviews, survey deployment, and analytics review. Deliverable: a synthesised insight report with ranked pain points and opportunities.
- Mapping workshop (week 5). Half-day or full-day facilitated session with cross-functional team. Deliverable: a draft journey map canvas with emotions, pain points, and ownership assigned.
- Prototype and review (week 6). Visual map produced in two formats: executive summary and operational detail. Deliverable: reviewed and signed-off map with ownership matrix.
- Implementable backlog (week 7–8). Quick-win roadmap with owners, metrics, and timelines. Deliverable: a prioritised action backlog and a measurement plan.
Client-facing deliverables from every Michaelbell mapping engagement:
- Visual journey map (executive summary and operational version)
- Insights register (ranked pain points and opportunities with supporting evidence)
- Ownership matrix (named owners per insight, with agreed metrics)
- Quick-win roadmap (actions deliverable within 30, 60, and 90 days)
- Measurement plan (baseline metrics and review cadence)
The workshop process itself is often where the most valuable work happens. As the Nielsen Norman Group observes, the cross-functional conversation during mapping creates shared definitions and accountability that the final graphic alone cannot produce. We design our workshops to capture that value deliberately, not as a by-product.
Why we prioritise journey maps at Michaelbell
Most agencies treat journey mapping as a discovery phase they run through quickly before getting to the “real work” of creative production. We think that gets it backwards.
The map is not the preamble to the communications programme. It is the reason the communications programme works. When you know precisely where a customer feels confused, undervalued, or ignored, you can write a brief that addresses that moment specifically. When you do not know, you write a brief that addresses what you hope the customer feels, which is a different thing entirely.
The teams we work with who invest properly in mapping, meaning real customer interviews, triangulated data, and a workshop that assigns ownership, consistently produce communications that land better and retain customers longer. The teams that skip it tend to produce work that looks good but do not move the metrics that matter.
When should you commission a mapping engagement from an agency rather than run it internally? When your team lacks the time or experience to conduct unbiased customer research. When the pain points you are trying to solve cross departmental boundaries and you need a neutral facilitator. When you need the output to carry credibility with a board or a senior leadership team. And when you want the map to connect directly to a communications programme rather than sit in a folder.
Michaelbell’s customer journey mapping service
Mapping the customer journey is one of the most direct routes to communications that actually work. Michaelbell brings together research, facilitation, and brand communications expertise so your map does not stop at a diagram. We turn the insights into a prioritised action backlog, a measurement plan, and, where relevant, the campaigns and content that address the moments that matter most.
Our engagements are fee-based and scoped to your objective, whether that is a two-week discovery sprint or a full programme covering multiple personas and journeys. You get the depth of an in-house research and strategy team without the overhead of building one. To find out what a mapping engagement looks like for your organisation, visit our customer journey service page or browse our full agency services to see how mapping connects to the wider communications work we do. Get in touch and we will get straight back to you.
Sources
The sources below are worth bookmarking for deeper study, templates, and methodology reference.
- Customer Journey Maps: When and How to Create Them – NN/G
- What Is a Customer Journey Map? Process, Stages, and Example
- What Is a Customer Journey Map & Why Is it Important?
- How to create customer journey maps in 2026 (+ templates)
- Online shopping cart abandonment rate worldwide – Statista