
How to optimise marketing spend with performance data

Optimise spend with performance data by measuring incrementality, applying profit-first funnel rules, and reallocating budget continuously. Done well, this approach typically lifts marketing ROI by 20–40% without increasing total spend. The shift is not about cutting; it is about moving money from channels that look good on paper to channels that genuinely drive new revenue.
Start here:
- Measure what is actually incremental. Platform-reported ROAS routinely overstates a channel’s true contribution because of attribution overlap. Incrementality testing gives you the real number.
- Use the right tools from day one. Google Analytics 4 (GA4) for web measurement, HubSpot for CRM and lead quality, and a dashboard in Looker Studio to unify spend, revenue, and marketing efficiency ratio (MER).
- Act within a week. Run a one-week spend audit by channel, flag any channel where MER is below your break-even threshold, and pause or reduce it. Then book a discovery call to scope a full 30/60/90-day plan.
Key takeaways
| Point | Details |
|---|---|
| Set KPIs in unit-economics terms | Define CPA, LTV, CAC, and break-even ROAS before touching any budget line. |
| Run incrementality tests | On/off holdouts reveal true channel contribution; act when incrementality falls below 50% of reported ROAS. |
| Protect a test budget | Reserve a modest portion of total spend for experiments so proven channels are not cannibalised. |
| Scale in measured steps | Increase winning channels by 20–30% at a time to avoid platform learning-phase disruption. |
| Michaelbell delivers the full stack | MB Brand Communications runs audit, measurement setup, incrementality testing, and monthly reallocation as a fee-for-service engagement. |
Table of Contents
- How to optimise spend with performance data: a five-step framework
- Which tools consolidate your cross-platform performance data?
- How do you measure incrementality and choose the right attribution model?
- How MB Brand Communications delivers optimisation in 30, 60, and 90 days
- A practical 30/60/90-day implementation plan
- Who owns what, and when should you outsource?
- What goes wrong when you optimise spend with performance data?
- Why measurement-first thinking changes what you can achieve
- MB Brand Communications: the agency-led route to faster results
- Sources
How to optimise spend with performance data: a five-step framework
This is the operational sequence we use to move marketing leaders from raw data to confident reallocation decisions. Hand it to your agency or internal team and run it in order.
-
Set clear goals and KPIs. Define success in unit-economics terms: target CPA, lifetime value (LTV), new-customer acquisition cost (CAC), and MER. Calculate your break-even ROAS from gross margin before you touch a single budget line. Aligning these metrics with business goals prevents the common trap of optimising for a metric that does not move profit.
-
Audit current spend by channel and campaign. Segment spend by new versus returning customers and by funnel stage. Most audits reveal that 20–30% of budget is funding retention activity that could be served at a fraction of the cost, freeing capital for acquisition.
-
Run incrementality and creative tests. On/off holdout tests and conversion lift studies tell you which channels are genuinely driving new revenue. For creative, pre-specify your hypothesis, isolate one variable, and require at least 50 conversions per variant at 95% confidence before calling a winner.
-
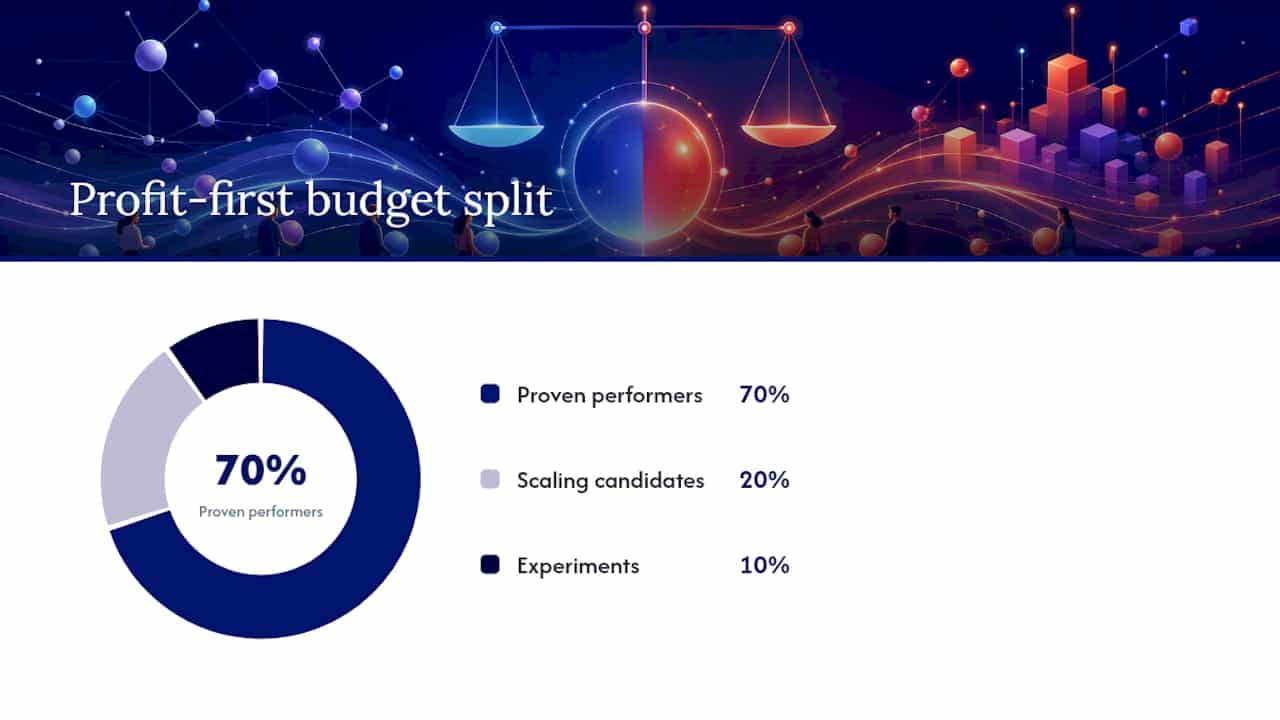
Apply profit-first reallocation rules. A practical starting split is 70% to proven performers, 20% to scaling candidates, and 10% to experiments. Pause any channel where incrementality falls below 50% of reported ROAS. Scale winners in steps of 20–30% to avoid triggering platform learning phases.
-
Build a continuous loop. Monthly reallocation reviews, a maintained testing log, and a protected test budget of 5–15% of total spend keep the system compounding. Documented learning reduces the cost per meaningful test over time.
Pro Tip: *Never double a channel’s budget in one move.
| Metric | What it tells you | When to act |
|---|---|---|
| MER (revenue ÷ total spend) | Overall marketing efficiency | Below break-even threshold: pause lowest performers |
| Incremental ROAS | True revenue driven by a channel | Below 1.0: cut or test off |
| New-customer CAC | Cost to acquire a net-new buyer | Above LTV ÷ target payback: reduce spend |
| CPA by funnel stage | Conversion cost at each stage | Rising CPA with flat volume: creative or audience issue |
Which tools consolidate your cross-platform performance data?
A reliable reporting stack does not need to be complex. It needs to be connected.
- GA4 tracks web behaviour, goal completions, and assisted conversions across sessions. Set up data-driven attribution in GA4 before you trust any channel-level number.
- Google Ads and Meta Ads (Facebook and Instagram) provide platform-reported ROAS and audience signals. Treat these as directional, not definitive, until you have incrementality data alongside them.
- LinkedIn Ads and TikTok Ads feed upper-funnel reach and engagement metrics. Both integrate with GA4 via UTM parameters and conversion APIs.
- HubSpot connects lead quality to spend. When you can see which channels produce leads that close and retain, CRM data sharpens every reallocation decision.
- Looker Studio (formerly Google Data Studio) pulls all platform data into a single allocation dashboard showing spend vs plan, MER trend, new-customer CAC by channel, and incrementality results.
- Rockerbox handles dedicated multi-touch attribution where GA4’s native modelling is insufficient, particularly for businesses running five or more paid channels simultaneously.
Real-time data feeds into this stack mean you can spot a deteriorating MER within days rather than waiting for a monthly report.
| Tool | Primary role | Key output |
|---|---|---|
| GA4 | Web measurement and attribution | Session data, goal completions, data-driven attribution |
| HubSpot | CRM and lead quality | Lead-to-close rate by channel, LTV by source |
| Looker Studio | Unified dashboard | Spend, MER, CAC, incrementality in one view |
| Rockerbox | Dedicated attribution | Multi-touch, incrementality-adjusted channel contribution |
How do you measure incrementality and choose the right attribution model?
Platform-reported ROAS can be misleading because multiple channels claim credit for the same conversion. That is the number to allocate against.
Calculating break-even ROAS is straightforward: divide 1 by your gross margin percentage. Any channel running below that figure is destroying margin, regardless of what the platform dashboard shows.
Attribution model choices depend on your funnel length. Last-click suits short, single-session purchase journeys. Data-driven attribution in GA4 is a better default for multi-session funnels. For budget decisions above a certain threshold, incrementality-adjusted ROAS should override both, because it reflects actual causality rather than correlation.
Pro Tip: Run an LTV-to-CPA comparison before cutting a channel. A channel with a high CPA but strong 12-month LTV may be your most profitable acquisition source once you account for repeat purchase behaviour.
| Attribution approach | Best for | Limitation |
|---|---|---|
| Last-click | Short, single-session funnels | Ignores upper-funnel contribution |
| Data-driven (GA4) | Multi-session, multi-channel funnels | Still subject to attribution overlap |
| Incrementality testing | All budget decisions above threshold | Requires holdout setup and patience |
How MB Brand Communications delivers optimisation in 30, 60, and 90 days
We run a structured agency engagement that moves from discovery to measurable reallocation within 90 days. Here is what that looks like in practice.
Days 1–30: Discovery and instrumentation
- Spend audit across all active channels, segmented by new vs returning customers
- Tracking and attribution health check (GA4, HubSpot, ad platform pixels)
- Quick reallocation of 5–15% of budget based on early MER signals
- Looker Studio dashboard live with spend, MER, and CAC by channel
Days 31–60: Testing and measurement
- Launch two to three incrementality tests (on/off holdouts or conversion lift)
- Run concept-first creative tests with pre-specified hypotheses and proper sample sizing
- Deliver mid-point reallocation recommendations based on early test signals
- Audience segmentation refined using HubSpot CRM data
Days 61–90: Reallocation and scaling
- Consolidated incrementality results with channel-level incremental ROAS scores
- Refreshed budget allocation applying the 70/20/10 framework
- Creative testing calendar and documented learning log for the next quarter
- MER, CPA, and conversion rate benchmarks vs baseline, with a clear improvement narrative
A practical 30/60/90-day implementation plan
Days 1–30: audit and quick wins
- Pull spend by channel for the last 90 days and calculate MER for each
- Fix tracking gaps in GA4 and ad platform conversion APIs
- Pause or reduce any channel where MER is below break-even ROAS
- Reallocate 5–15% of freed budget to the highest-incrementality channel
Days 31–60: test and measure
- Launch holdout incrementality tests on your two largest spend channels
- Run concept-first creative tests sized to at least 50 conversions per variant
- Review HubSpot lead quality data to identify which channels produce buyers, not just leads
Days 61–90: scale and document
- Apply final incrementality results to a refreshed allocation
- Scale winners in 20–30% increments
- Publish a testing log and reallocation rationale for internal sign-off
- Set the monthly review cadence for the next quarter
Who owns what, and when should you outsource?
Clear roles prevent slow decision cycles, which are one of the most common reasons reallocation never actually happens.
- Head of marketing: owns the allocation decision and signs off monthly budget shifts
- Performance analyst: runs the reporting stack, flags signals, and sizes tests
- CRM owner: connects HubSpot lead quality to channel spend
- Creative lead: manages the testing calendar and creative refresh cadence
- Agency delivery lead: owns incrementality test design, dashboard maintenance, and reallocation recommendations
Decision cadence:
- Weekly: tactical review of spend pacing, MER, and creative frequency
- Monthly: full allocation review with incrementality results and reallocation decisions
- Quarterly: LTV recalibration, strategy review, and 70/20/10 split adjustment
When evaluating an agency partner, look for these criteria:
| Criterion | What to ask |
|---|---|
| Measurement capability | Can they set up GA4, Rockerbox, and a unified dashboard from day one? |
| Incrementality experience | Have they run holdout tests? Can they show you the methodology? |
| Case study evidence | Do they have before/after MER or CPA data from comparable clients? |
| References | Will they connect you with a current client in a similar sector? |
| Commercial model | Is it fee-for-service with clear deliverables, not a retainer with vague outputs? |
Structuring your agency roster around these criteria reduces the risk of paying for activity that never translates to reallocation.
What goes wrong when you optimise spend with performance data?
Most budget drain comes from a handful of repeatable mistakes.
- Relying on platform ROAS alone. Google Ads and Meta Ads both have a commercial incentive to show high ROAS. Without incrementality data alongside platform numbers, you are optimising against a metric that flatters the platform.
- Underfunded tests. A test that runs for two weeks with 20 conversions per variant produces noise, not signal. Size every test to at least 50 conversions per variant at 95% confidence before drawing conclusions.
- Ignoring creative fatigue. Rising frequency with falling ROAS is a clear signal that your audience has seen the creative too many times. Algorithmic campaign types like Advantage+ and Performance Max need higher creative volume to keep the platform finding fresh audiences.
- Missing channel interaction effects. Pausing paid social while scaling paid search often lifts search conversion rates, because social was warming the audience. Treat channels as a system, not independent levers.
Red-flag signals to watch:
- MER falling below your break-even threshold for two consecutive weeks
- Incrementality below 50% of reported ROAS on a major channel
- Frequency above 4.0 on Meta with ROAS declining week on week
Pro Tip: Set automated alerts in Looker Studio for MER and frequency thresholds. Catching a deteriorating signal on day three is far cheaper than discovering it at the monthly review.
Why measurement-first thinking changes what you can achieve
Most agencies lead with creative. We lead with measurement, and the creative follows the data. That sequence matters because it means every pound of spend has a defined success condition before it goes out the door.
The clearest example of this in practice: a client running four paid channels with a blended ROAS that looked healthy. Reallocating that budget to the two genuinely incremental channels reduced CPA by roughly a third within 60 days, with no increase in total spend. The creative did not change. The measurement did.
Brand investment still matters in this model. We do not advocate cutting brand spend to chase short-term MER. We advocate measuring it properly so you know what it is actually contributing, and holding it at the right proportion of total budget.
MB Brand Communications: the agency-led route to faster results
MB Brand Communications delivers the full optimisation stack without the overhead of an in-house team. We run the spend audit, set up GA4 and Looker Studio, design and execute incrementality tests, and produce monthly reallocation recommendations with clear commercial rationale. Our fee-for-service model means you commission specific deliverables, not an open-ended retainer. The first engagement is a scoped discovery and 30-day audit: you get a channel-by-channel MER analysis, a tracking health report, and an initial reallocation recommendation, all within the first month.

We are passionate about getting this right for you, and we get straight to work. See the full range of agency services and book a discovery call to scope your 30-day audit.
Sources
The following resources informed the framework and recommendations in this article.
- Ad Creative Testing Strategy: Data-Driven Guide (2026) | Wevion
- How to Optimize Ad Spend Allocation: A 7-Step Framework
- Creative Testing for Paid Ads: A 2026 Playbook · Tadka