
Marketing cost per output: your guide to smarter budgets

Marketing cost per output is the total marketing spend divided by the number of outputs produced in a given period. The formula is simple: Cost per output = Total marketing input ÷ Chosen output. Spend £5,000 on a campaign that generates 250 leads and your cost per output is £20. That single number tells you exactly what each result is costing you, and whether your budget is working hard enough.
The “output” you choose depends on what you are measuring: revenue generated, new customers acquired, marketing-qualified leads (MQLs), sales opportunities, or conversions. The metric is sometimes called cost per acquisition (CPA) when the output is a paying customer, but the broader term covers any defined result. It sits within the wider discipline of marketing cost analysis, which assesses all resources invested, including money, hours, and media purchases, to judge whether expected returns justify the spend.
Key takeaways
Marketing cost per output is calculated by dividing your total, fully loaded cost pool by the number of outputs produced, and that number should always be reconciled against MER and CAC before any budget decision is made.
| Point | Details |
|---|---|
| Core formula | Cost per output = total marketing input ÷ chosen output; always use a fully loaded cost pool. |
| Build the right cost pool | Include media spend, agency fees, software, production, and allocated staff time, not ad spend alone. |
| Standardise attribution | Choose one attribution model and one window across all channels; document every assumption. |
| Report at the right cadence | Weekly for campaign optimisation, monthly for performance, quarterly for strategic budget reviews. |
| Michaelbell’s approach | Michaelbell builds fully loaded cost pools and attribution frameworks for UK clients, connecting campaign-level cost per output to board-level MER reporting. |
Table of Contents
- Why measure marketing cost per output?
- What should you include in your cost pool?
- How do CPA, CPL, CPM, ROAS and MER differ?
- How to calculate marketing cost per output, step by step
- A worked example in GBP
- How do you know if your cost per output is acceptable?
- Common mistakes that make cost per output misleading
- How Michaelbell measures and optimises cost per output for clients
- The metric that tells you the truth, if you let it
- Michaelbell can help you measure what actually matters
- Sources
Why measure marketing cost per output?
Knowing what each result costs you is the foundation of every sensible budget decision. Without it, you are allocating spend on instinct rather than evidence.
The metric earns its place across several practical use cases:
- Budget allocation: compare channels on a like-for-like basis and direct spend toward the ones producing the lowest cost per output.
- Campaign prioritisation: rank live campaigns by efficiency and pause or scale based on real numbers, not gut feel.
- Board reporting: translate marketing activity into a financial metric that non-marketers immediately understand.
- Channel comparison: weigh paid search against email, direct mail, or social on the same output basis.
Cost per output also connects directly to unit economics. That ceiling is your allowable CPA, and cost per output is how you track whether you are staying inside it.
The decisions it supports are concrete: stop a channel that consistently exceeds your allowable cost, scale one that sits well below it, reallocate budget mid-quarter when the numbers shift, or test a new format with a defined efficiency target. Used alongside blended metrics like marketing efficiency ratio (MER) and customer acquisition cost (CAC), cost per output gives you both the granular campaign view and the business-level picture at the same time.

What should you include in your cost pool?
Getting the cost pool right is where most calculations go wrong. A cost pool that only captures ad spend will produce a number that looks good but understates the real cost of every output you generate.
Direct costs are the easiest to include: paid media spend across all channels, creative production fees, landing-page builds, and any direct mail production or postage. These map cleanly to a campaign and period.
Indirect and shared costs require allocation. A thorough marketing cost analysis includes agency retainers, marketing software subscriptions, analytics tools, A/B testing platforms, and the portion of staff time spent on the campaign. These costs are real, even when they do not appear on a media invoice.
Apply the same logic to shared software licences. It is not perfect, but it is consistent and defensible.*
UK-specific notes worth keeping in mind:
- Agency fees in the UK are typically charged ex-VAT. If your business is VAT-registered and can reclaim input VAT, exclude VAT from your cost pool to avoid inflating the figure. If you cannot reclaim it, include the VAT-inclusive amount.
- Report all figures in GBP and keep the currency consistent across periods. If you run campaigns in other currencies, convert at the rate applicable to the payment date, not the reporting date.
- When using an agency on a retainer model, allocate the monthly retainer fee proportionally across active campaigns rather than attributing it entirely to the largest campaign.
The practical rule for overheads: include costs you can trace to marketing activity; stop at costs that would exist regardless of whether any campaign ran (general office rent, for example). The goal is a cost pool that is comparable period to period, not one that is theoretically perfect.
How do CPA, CPL, CPM, ROAS and MER differ?
Each metric answers a different question. Picking the wrong one for a decision is as costly as using no metric at all.
| Metric | Formula | Scope | Typical use case |
|---|---|---|---|
| CPA (cost per acquisition) | Total spend ÷ acquisitions | Campaign or channel level | Optimising paid campaigns for customer volume |
| CPL (cost per lead) | Total spend ÷ leads generated | Campaign or channel level | B2B pipeline and lead-gen programmes |
| CPM (cost per thousand impressions) | (Spend ÷ impressions) × — | Ad placement level | Awareness campaigns; media buying |
| ROAS (return on ad spend) | Revenue ÷ ad spend | Platform or campaign level | Direct-response channel efficiency |
| MER (marketing efficiency ratio) | Total revenue ÷ total marketing spend | Business level, blended | Executive reporting; cross-channel decisions |
CPA measures the average cost of one conversion from a defined spend pool. It is the most direct expression of cost per output when the output is a customer or conversion. CPL narrows that to lead generation, which matters in B2B where leads and customers are separated by a sales cycle.
ROAS is platform-reported and fast to calculate, but it only captures ad spend in the denominator. MER uses total marketing spend, making it far more useful for board-level decisions where you need a single, honest number. The distinction matters: a campaign can show a strong ROAS while the business-level MER is deteriorating because agency fees and tooling costs are rising.
One critical gap to understand: platform-reported CPA and fully loaded CAC are not the same figure. Fully loaded CAC, which includes salaries, software, agency retainers, and overhead, is significantly higher than the CPA your ad platform reports. Use platform CPA for campaign optimisation; use fully loaded CAC for unit-economic and profitability decisions.
How to calculate marketing cost per output, step by step
A repeatable process matters more than a one-off calculation. Here is the methodology we recommend.
-
Define the output you will measure. Choose one: new customers, MQLs, sales opportunities, or revenue. Mixing outputs in a single calculation produces a meaningless number. If you need to track multiple outputs, run separate calculations for each.
-
Build the cost pool for the chosen period. List every cost that contributed to producing that output: paid media, creative, production, agency fees, software, and allocated staff time. Exclude costs that are unrelated to marketing activity. Document what you included and why, so the calculation is reproducible.
-
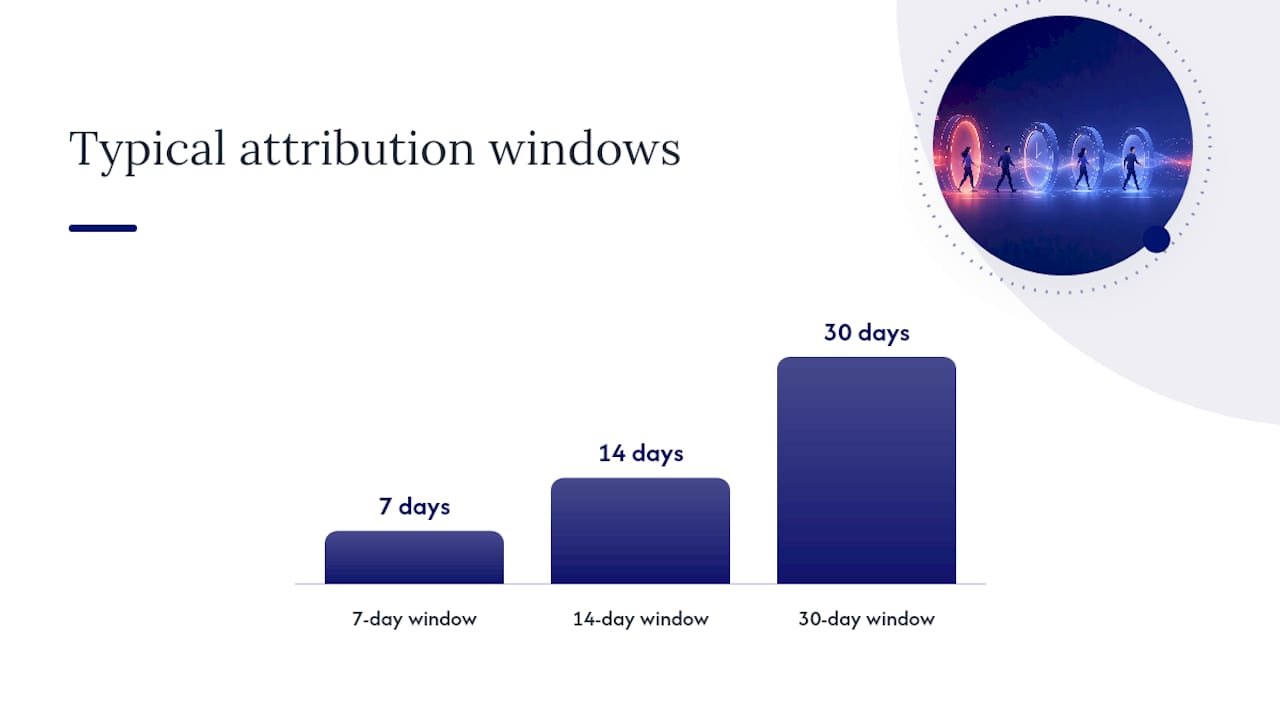
Choose an attribution model and apply it consistently. Last-click attribution is simple but over-credits the final touchpoint. Multi-touch models (linear, time-decay, or position-based) distribute credit more fairly across the customer journey. Revenue-based attribution weights touchpoints by their contribution to closed revenue. Whichever model you choose, apply it across all channels and document the window (typically 7, 14, or 30 days). Inconsistent windows across channels are one of the most common sources of misleading cost-per-output figures. For practical guidance on ad campaign tracking and attribution setup, a structured tracking framework helps enormously.
-
Calculate and test sensitivity. Divide total cost pool by total outputs. Then run a sensitivity check: what happens to cost per output if your conversion rate drops by 10%? What if you include or exclude agency retainer costs? Sensitivity testing reveals how robust your number is and which assumptions carry the most risk.
Recommended reporting cadence: weekly for live campaign optimisation, monthly for performance reporting, and quarterly for strategic budget reviews. Quarterly reviews are where cost per output feeds into data-driven decisions about channel mix and annual budget allocation.
A worked example in GBP
A UK-based B2B software company runs a quarter’s worth of marketing activity. Here are the inputs:
During the quarter, the campaigns generated 90 new customers and £72,000 in new revenue.
Cost per output (per new customer): £18,000 ÷ 90 = £200 per customer
MER: £72,000 ÷ £18,000 = 4.0 (for every £1 of marketing spend, £4 of revenue was generated)
CPA (platform-reported, paid search only): £8,000 ÷ 60 platform-attributed conversions = £133 per conversion
The gap between the platform CPA of £133 and the fully loaded cost per customer of £200 illustrates exactly why relying on platform figures alone understates your real acquisition cost.
Sensitivity check: if the conversion rate on paid search drops by 15%, platform-attributed conversions fall from 60 to 51, and the fully loaded cost per customer rises to approximately £225, a 12.5% increase from a single channel’s performance shift. Small changes in conversion rate move the number meaningfully, which is why testing messaging and conversion rate is as important as managing media spend.
The output-per-input ratio for this example is 4.0 (£72,000 revenue ÷ £18,000 spend), sitting at the upper end of what many businesses consider a healthy range.
How do you know if your cost per output is acceptable?
There is no universal benchmark, and anyone who gives you one without knowing your margins is guessing. The right starting point is your own unit economics.
Allowable CPA formula: Average order value × Gross margin % = Maximum allowable cost per customer (before marketing erases profit).
Rules of thumb by business model:
- E-commerce: cost per customer typically needs to sit below 20–30% of average order value for a single transaction to be profitable. Repeat purchase rates change this significantly.
- B2B: longer sales cycles mean cost per opportunity or cost per MQL is more useful than cost per customer in the short term. A cost per MQL of 5–15% of average contract value is a reasonable starting range.
- Subscription: CAC payback period (months of revenue to recover acquisition cost) is often more useful than a single cost-per-output figure. A payback period under 12 months is generally considered healthy.
UK reporting notes: VAT-registered businesses should confirm whether their cost pool uses ex-VAT figures consistently. Mixing VAT-inclusive and ex-VAT costs in the same pool distorts comparisons across periods. Quarterly reviews align well with UK financial reporting cycles and give enough data to distinguish signal from noise in most channels. Communications refresh cycles tied to quarterly reviews help keep creative performance from degrading and inflating cost per output over time.
Common mistakes that make cost per output misleading
Getting the formula right is only half the job. These are the errors that produce numbers you cannot trust.
- Using platform CPA as a proxy for fully loaded cost. Ad platforms report only the spend you put through them. Include allocated overheads, agency fees, and tooling, or label the figure clearly as “platform CPA” so no one mistakes it for a business-level number.
- Inconsistent attribution windows across channels. A 7-day window on paid search and a 30-day window on email will double-count conversions and understate cost per output. Standardise windows across all channels and document any deviations.
- Mixing outputs without normalisation. Combining leads and revenue-generating customers in the same denominator produces a figure that means nothing. Pick one output per calculation, or normalise each output type to a common unit value before combining.
- Ignoring time-to-value in long sales cycles. A B2B campaign that generates pipeline in Q1 may not close revenue until Q3. Measuring cost per output at the end of Q1 will look expensive. Use cohort analysis or a CAC payback metric alongside cost per output to account for the lag.
How Michaelbell measures and optimises cost per output for clients
At Michaelbell, we start every engagement with a discovery phase that maps the client’s existing cost pool: what is being tracked, what is missing, and where platform metrics are being used as substitutes for business-level figures. That gap analysis alone often reveals that reported efficiency is materially better than actual efficiency.
From there, we build a cost pool framework that is consistent, documented, and reproducible. We recommend an attribution model suited to the client’s sales cycle and channel mix, whether that is last-click for simple e-commerce or a multi-touch model for B2B programmes with longer journeys. Our customer journey analysis work is particularly useful here: understanding where in the journey value is created changes which attribution model produces the most honest cost-per-output figure.
We then set a testing cadence, weekly reviews for live campaigns, monthly for reporting, quarterly for strategic reallocation, and build the reporting into a format that works for both marketing teams and board-level stakeholders. Our agency partnership model means clients get consistent measurement discipline without needing to build an in-house analytics function from scratch.
The metric that tells you the truth, if you let it
Cost per output is one of the most honest metrics in marketing. It does not care which channel generated the result or how impressive the impressions looked. It asks one question: what did each output actually cost?
The risk is treating it as the only question. We have seen businesses cut brand spend because it produced a high cost per output in the short term, only to watch their cost per acquisition rise six months later as brand awareness eroded. Brand investment does not always show up in this quarter’s cost-per-output figure, but it absolutely shows up in next year’s.
The most effective approach is mixed-metric governance: cost per output for campaign-level decisions, MER for executive reporting, and CAC payback for long-term investment cases. No single number tells the whole story. The businesses we work with that use cost per output most effectively are the ones who treat it as one instrument in a dashboard, not the entire dashboard. Over-optimising a single metric is how you end up with efficient campaigns and a weakening brand.
Michaelbell can help you measure what actually matters
If your cost-per-output figures are based on platform data alone, you are almost certainly working with an understated number. Michaelbell works with UK marketing teams to build fully loaded cost pools, select the right attribution model, and set up a reporting cadence that gives you confidence in every budget decision.
Our agency services cover the full measurement picture: cost pool audits, attribution modelling, campaign optimisation, and customer journey analysis. Clients typically come away with a clear view of their real cost per output, a tested attribution framework, and a reporting structure that works for both their marketing team and their board. To find out how we can apply this to your business, get in touch and we will get straight back to you.
Sources
The following sources informed the formulas, definitions, and guidance in this article. They are worth bookmarking if you want to go deeper on any of the metrics covered.
- Marketing output per input calculator | PanCalcHub